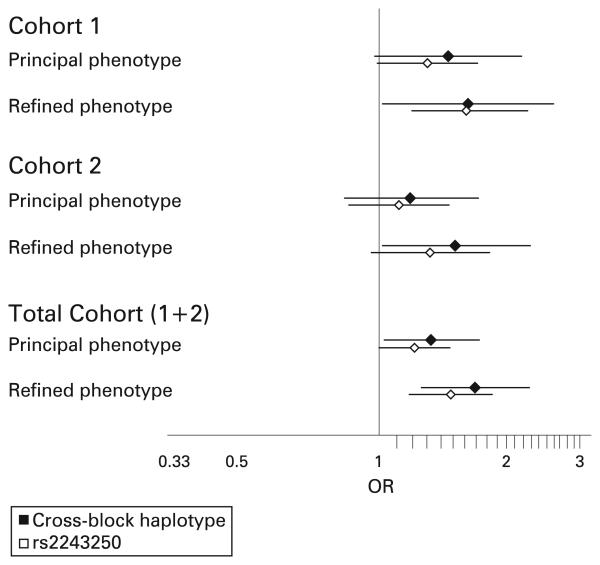
Figure 3.
Summary of association statistics for cohort1 1, cohort 2 and total cohort data for the single SNP with the strongest association (rs2243250) and for the cross-block risk haplotype. In all datasets the effect is stronger for the cross-block haplotype than for the single SNP, and stronger for the refined age-limited phenotype than for the principal phenotype. The cross-block haplotype is independently significant in both cohort 1 and cohort 2. OR, odds ratio.

