Figure 6.
Increased Ray Production in the Activation-Tagged Mutant and PtaLBD1-oe Plants.
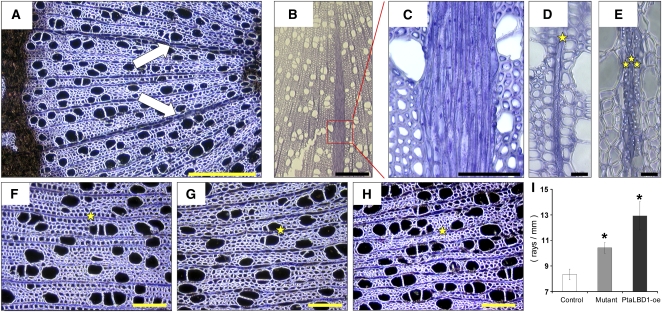
(A) to (C) Biseriate (A) and multiseriate ([B] and [C]) rays can be frequently observed in mutant (A) and PtaLBD1-oe plants ([B] and [C]). (C) represents a higher magnification of the boxed area shown in (B). Arrows point to biseriate rays.
(D) and (E) Typical uniseriate rays in WT-717 (D) compared with muliseriate rays in PtaLBD1-oe (E) plants. Stars indicate files of ray cells.
(F) to (H) Rays’ density in WT-717 (F), mutant (G), and PtaLBD1-oe plants (H). Stars represent typical rays that were scored to derive the data in (I).
(I) Quantification of ray density. Ray density was quantified in multiple sections, such as those shown in (F) to (H); values are reported as means ± se (n = 5). Asterisks indicate significant differences relative to WT-717 plants as determined by Student’s t test at P < 0.05.
Bars = 500 μm in (A) and (B), 100 μm in (C), 200 μm (F) to (H), and 20 μm in (D) and (E).

