Figure 3.
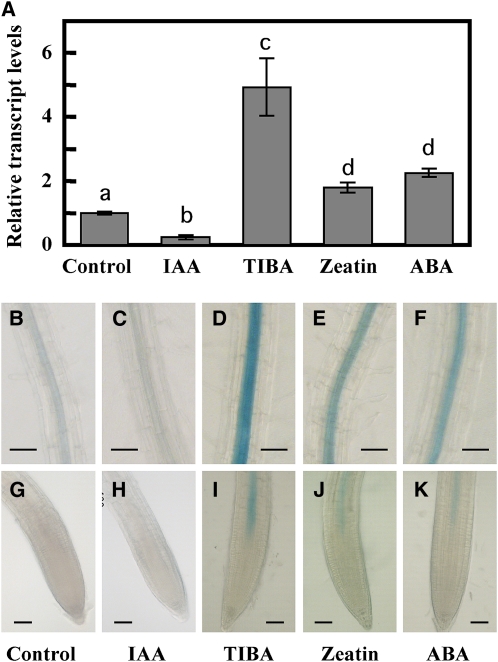
ABI4 Expression Is Hormone Regulated.
(A) qRT-PCR analysis of ABI4 transcripts in 2-week-old wild-type plants treated for 4 h with 20 μM of the specified agents. The data represent the mean ± se of n = 3 independent experiments. Bars with different letters represent statistically different values using Tukey’s HSD post-hoc test (P ≤ 0.05).
(B) to (K) GUS staining of roots of 2-week-old ABI4:GUS/wild-type plants treated as in (A).
(B) to (F) Upper root zone.
(G) to (K) Root tips. Bars = 50 μm.

