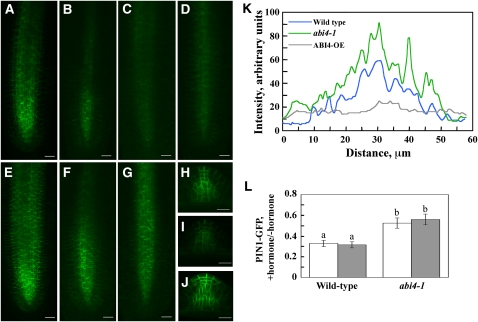
Figure 9.
ABI4 Affects PIN1 Distribution.
(A) to (G) PIN1-GFP was visualized in PR tips of 12-d-old PIN1:PIN1-GFP/wild-type ([A] to [C]), PIN1:PIN1-GFP/ABI4 overexpressor (D), and PIN1:PIN1-GFP/abi4 mutant ([E] to [G]) seedlings with a fluorescent microscope.
(A), (D), and (E) Untreated seedlings.
(B) and (F) Treated with 10 μM ABA for 24 h.
(C) and (G) Treated with 10 μM zeatin for 24 h. Bars = 20 μm.
(H) to (J) PIN1-GFP expression in untreated emerging LRs.
(H) PIN1:PIN1-GFP/wild type.
(I) PIN1:PIN1-GFP/ABI4 overexpressor.
(J) PIN1:PIN1-GFP/abi4 mutant. Bars = 20 μm.
(K) and (L) Quantification of the fluorescence intensity.
(K) Images shown in (A), (D), and (E) were scanned transversally using ImageJ 1.42q software. Presented pattern was taken 60 μm above root tips. Similar patterns were obtained when other sections were analyzed.
(L) Pixel intensities of four root images were determined using ImageJ 1.42q. Ratios of the values obtained for ABA-treated (white bars) or zeatin-treated (gray bars) plants to that of nontreated plants were calculated for both wild-type and abi4-1 background. The data represent the mean ± se of n = 4. Bars with different letters represent statistically different values by Tukey’s HSD post-hoc test (P ≤ 0.05).

