Figure 4.
Expression Pattern of TPST.
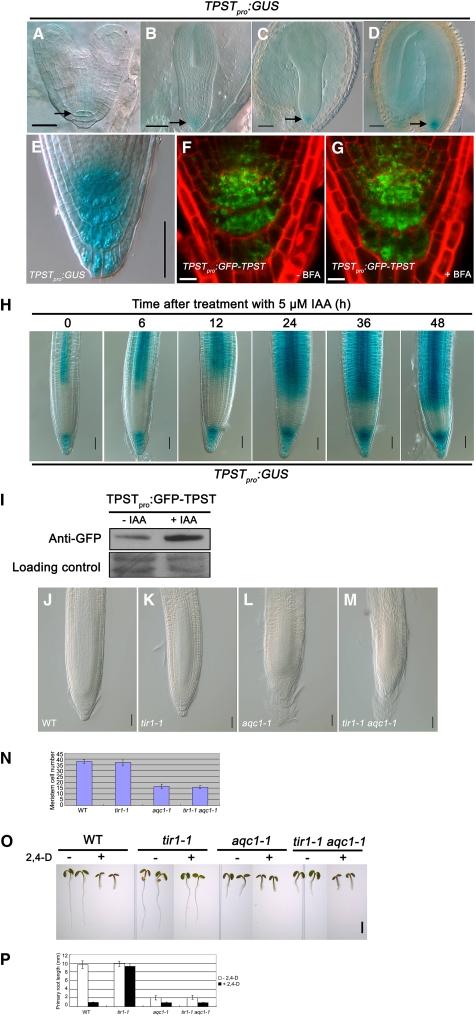
(A) to (D) TPSTpro:GUS expression pattern during the embryo stage, from early heart-stage embryo (A), torpedo-stage embryo (B), early cotyledon-stage embryo (C), to cotyledon-stage embryo (D). TPSTpro:GUS is first expressed in the central cell and surrounding cells. Bars = 20 μm in (A) and 50 μm in (B) to (D).
(E) TPSTpro:GUS expression in the root tip of a representative 4 DAG seedling. Bar = 50 μm.
(F) and (G) TPST expression shown by the TPSTpro:GFP-TPST translational fusion. Seedlings (5 DAG) containing the TPSTpro:GFP-TPST construct were either not treated (F) or treated with 10 μM brefeldin A (BFA) for 2 h (G). Bars = 10 μm.
(H) Auxin-induced expression of TPSTpro:GUS. Transgenic seedlings (4 DAG) were treated with 5 μM IAA for the indicated times before GUS staining assays. Bars = 50 μm.
(I) Protein gel analysis showing that auxin upregulates the levels of the TPSTpro:GFP-TPST fusion protein. Proteins were extracted from 5-DAG transgenic seedlings treated with or without 5 μM IAA for 12 h and subjected to immunoblot using anti-GFP antibody. Ponceau S–stained membranes are shown as loading controls.
(J) to (N) Genetic analysis between aqc1-1 and tir1-1. WT, wild type.
(J) to (M) Root tips of the wild type (J), tir1-1 (K), aqc1-1 (L), and tir1-1 aqc1-1 (M) at 5 DAG. Bars = 50 μm.
(N) Meristem cell numbers of the indicated genotypes at 5 DAG. Data shown are average and sd (n = 12).
(O) Phenotypes of indicated plants without or with 30 nM 2,4-D at 3 DAG. Bar = 2 mm.
(P) Primary root lengths of the indicated plants without or with 30 nM 2,4-D at 3 DAG. Data shown are average and sd (n = 10).

