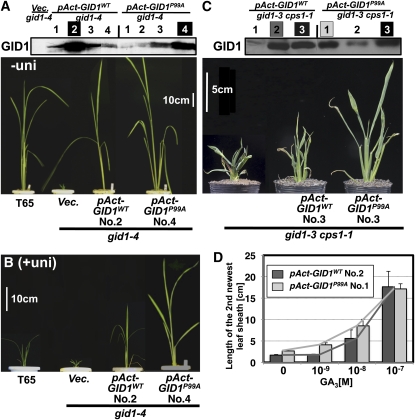
Figure 6.
GA-Independent GA Signaling by GID1P99A in Planta.
(A) Top: Amount of GID1s produced in pAct-GID1WT (4 lines), pAct-GID1P99A (4 lines), and the vector control (Vec.) plants in gid1-4 background estimated by immunoblot analysis using an anti-GID1 antibody.
Bottom: Gross morphology of pAct-GID1WT and pAct-GID1P99A plants in gid1-4 background grown under normal conditions for 3 weeks. gid1-4 plants transformed with the vector control (Vec.) and wild-type (T65) plants are also shown. Bar = 10 cm.
(B) Same genotypes as in (A), grown with 10−6 M uniconazol for 3 weeks. Bar = 10 cm.
(C) Top: Amount of GID1s produced in pAct-GID1WT (three lines) and pAct-GID1P99A (three lines) plants in a gid1-3 cps1-1 background estimated by immunoblot analysis using an anti-GID1 antibody.
Bottom: Gross morphology of pAct-GID1WT and pAct-GID1P99A plants in a gid1-3 cps1-1 background grown under normal conditions for 3 weeks. Bar = 5 cm.
(D) Dose dependency of leaf sheath elongation of pAct-GID1WT and pAct-GID1P99A plants in a gid1-3 cps1-1 background grown in GA3 for 1 week (mean ± sd; n = 3).

