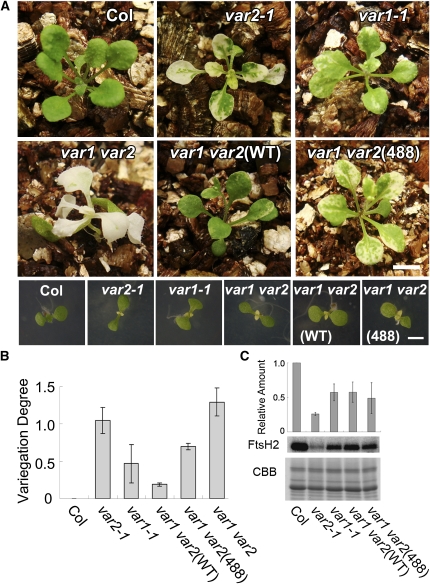
Figure 8.
Complementation Analysis of var1 var2 with Wild-Type and Mutated FtsH2.
(A) Photographs of 3-week-old (top panels) and 8-d-old (bottom panels) Col, var2-1, var1-1, var1 var2, var1 var2(WT), and var1 var2(488). Bars = 6 mm in the top panels and 3 mm in the bottom panels.
(B) Evaluation of leaf variegation using digital image analysis. The degree of leaf variegation of the first three true leaves (at 3 weeks) was estimated as described in Methods. The value was estimated from three independent experiments (bars indicate sd; n = 3) and normalized according to Col (Col was set to 0).
(C) Immunoblot analysis of FtsH2. Total proteins from 3-week-old seedlings were probed with anti-FtsH2 antisera (normalized by fresh weight). A CBB-stained gel of the samples is shown on the bottom. Relative levels of FtsH2 (normalized by LHCII; Col was set to 1) are shown at the top (bars represent sd; data from three biological repeats).

