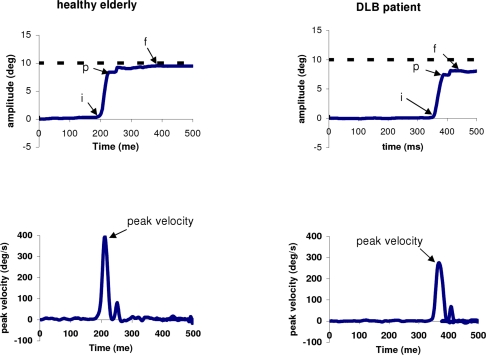
Figure 2.
Typical recordings of horizontal saccade are obtained by averaging the position signal of the two eyes (LE + RE)/2 and their corresponding velocity traces for one healthy elderly and one DLB patient. The arrows “i” and “p” indicate the onset and the end of the primary saccade, respectively; the arrow “f” for the final eye position Figure 4. Examples of saccade latencies distribution with trials from some controls and DLB patients in the gap task. The mean values and the variability (standard deviation/mean latency) of saccade latency are presented in the box. All three DLB patients show abnormal long latency.

