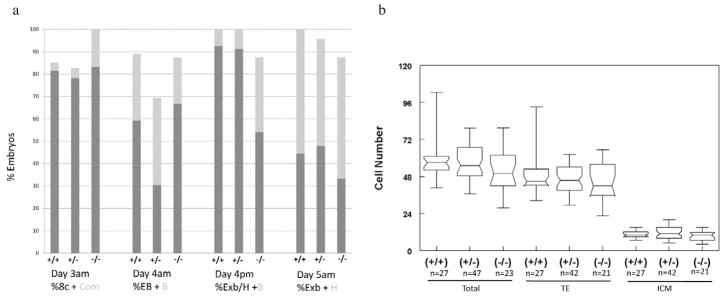
Figure 2.
Developmental assessment of Dld-deficient embryos. (a) Assessment of morphological progression. The results from four morphological assessments are shown in the graph. The genotypes of the embryos are presented below. The numbers in each genotypic category were: +/+, 27; +/−, 47; −/−, 24. The times of evaluation and a designation of the morphological categories are shown under the graph. 8c-8-cell; com = compacting; EB = early blastocyst (less than two-thirds of the volume of the embryo); B = blastocyst (greater than or equal to two-thirds of the volume of the embryo); ExB = expanded blastocyst; H = hatching blastocyst. (b) Differential cell counts according to genotypes and cell type. TE = trophectoderm; ICM = inner cell mass.

