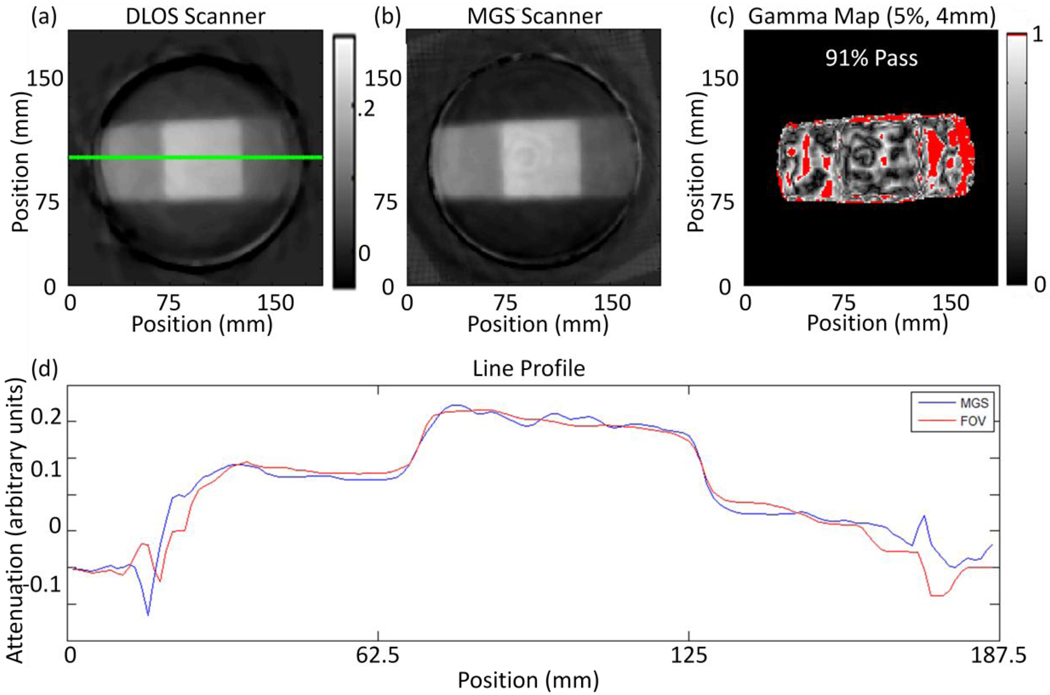
Figure 5.
(a) Reconstructed slice from the DLOS system. (b) The same reconstructed slice from the MGS scanner. Both scans were acquired with 360 projections over 360 degrees. (c) A 5%, 4 mm, 5% threshold for the slices shown in (a) and (b) with a 91% pass rate calculated only from pixels within the dosimeter. (d) Line profiles taken from the green line in slices (a) and (b).

