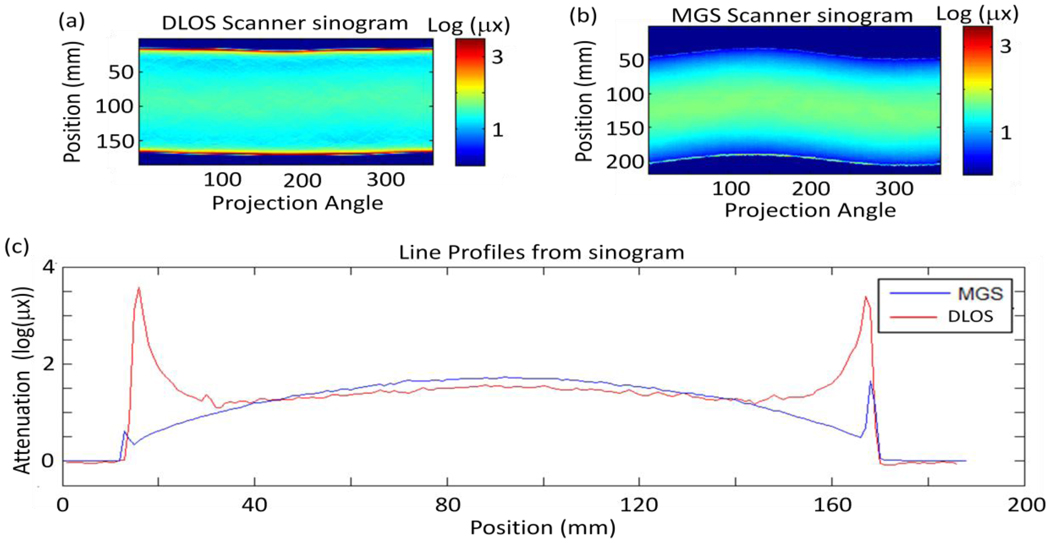
Figure 6.
(a) Flood corrected sinogram from prescan captured with the large DLOS system. (b) Flood corrected sinogram from the prescan acquired with the MGS scanner & (c) a set of line profiles from each sinogram in (a) and (b) showing the differences in the scanners. Most evident are the edge artefacts present in each scanner, however, those in the DLOS system are much more pronounced and alters the shape of the curve for the 1st and last 25 mm of each projection angle. The same fluid was used in each scan and shows how the MGS scanner is much less sensitive to the refractive index match.

