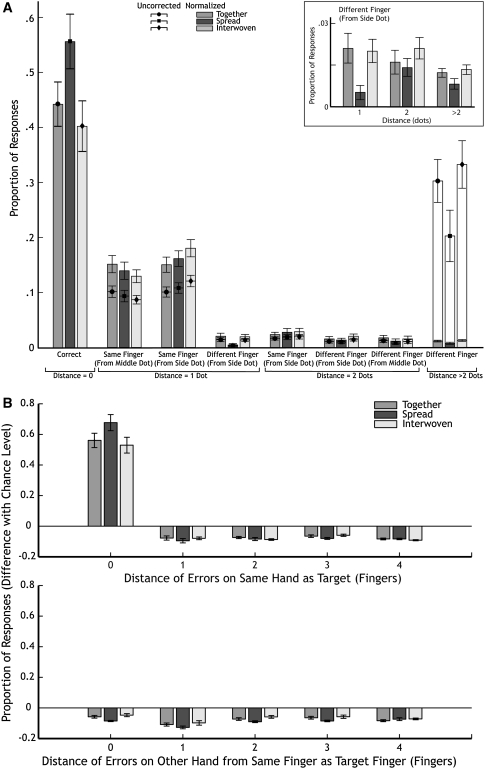
Fig. 2.
Proportion of responses in experiment 1 averaged over all participants (with standard errors). a Symbols (and open bars) proportions of responses. Solid bars proportions normalized by the number of possibilities of this response occurring (for details, see text; values are given in Table 1). Inset the critical values of the normalized responses, enlarged for clarity. b Normalized proportions for the distance in numbers of fingers from the target on the stimulated hand (upper panel) or the other hand (lower panel). The positions on the other hand are calculated as if the same finger of that hand was stimulated (e.g. if the middle finger was stimulated, an error of distance 1 would be to either the index or the ring finger. An error of distance 1 on the other hand would be to the index or ring finger of the other hand)

