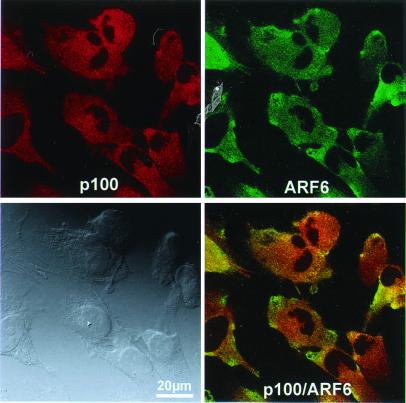
Figure 7.
Intracellular distribution of ARF-GEP100 and ARF6 in T98G cells. Cells were reacted with rabbit anti-ARF-GEP100 (p100) antibody and mouse anti-ARF6, followed by Texas Red-labeled anti-rabbit IgG and FITC-labeled anti-mouse IgG. Lower right panel is a composite of the superimposed images. Lower left panel shows the corresponding Normarski image.

