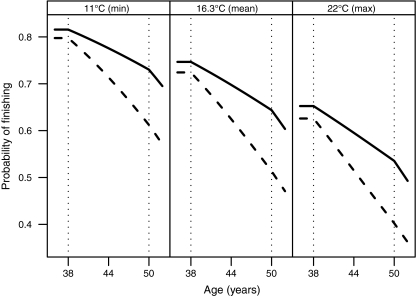
Fig. 2.
Predicted probability of finishing as a function of age, sex, and ambient temperature. Solid curves represent men and dashed curves represent women. Vertical dotted lines mark the first and third quartiles of age, where the model allowed the slope to change as described in “Methods”. Probabilities are for an average starter who had not started since 1985 (a “first-timer”). The three panels correspond to the least, average, and greatest values of minimum air temperature that occurred among the 22 yearly WSER events under consideration. Probabilities are adjusted to 1996 rates; for other years the pattern is adjusted up or down as shown in Fig. 1. The display has been truncated after 60 years because extrapolation of results to the small population of WSER starters above that age would likely be inaccurate. Probabilities for starters who had previously started since 1985 were similar, but adjusted up or down as shown in Fig. 1

