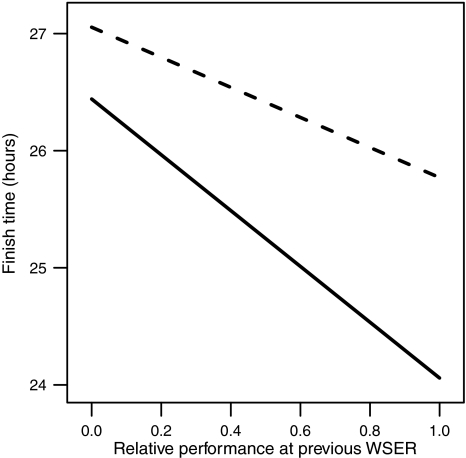
Fig. 5.
Average finish time as a function of relative performance at previous WSER start and percent previous starts finished since 1986, for finishers for whom previous relative performance was defined. The solid line represents those who had finished 100% of previous starts, the dashed line those who had finished 50% of previous starts. Finishers who finished 0% of their previous WSER starts since 1985 are represented in Fig. 4. Estimates are adjusted to represent an average man aged 44 with no WSER finish before 1986, subject to 16.3°C minimum air temperature

