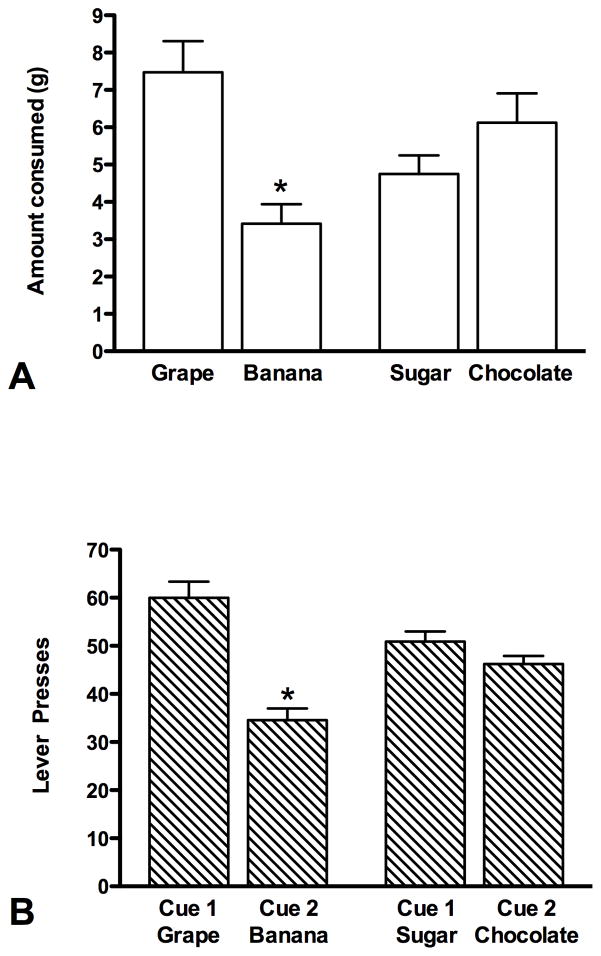
Figure 3.
A) Consummatory preference test. The bars represent the mean (+SEM) amount of each type of food consumed; grape and banana pellets (group GB) or sugar and chocolate pellets (group SC) *denotes a significant difference (p<0.05) between food choices (between grape and banana). B) Instrumental (cue) preference test. The bars represent the mean (+/− SEM) number of lever presses to the cue associated with each food; Cue 1 (predicts grape pellets) and Cue 2 (predicts banana pellets) for group GB and Cue 1 (predicts sugar pellets) and Cue 2 (predicts chocolate pellets) for group SC *denotes a significant difference (p<0.05) between Cue 1 (when it predicts grape) and Cue 2 (when it predicts banana).

