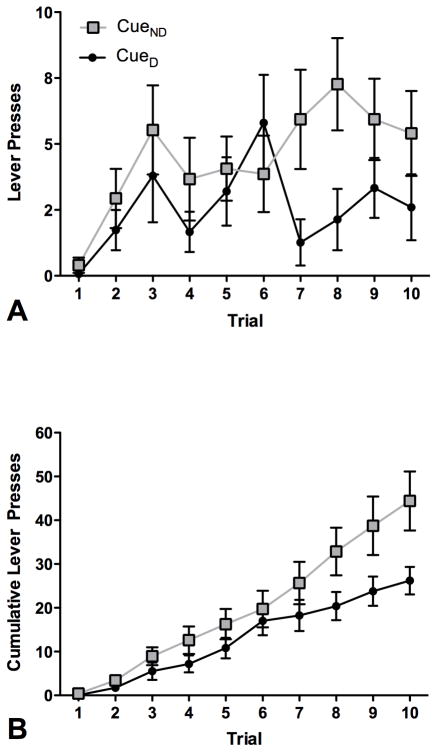
Figure 5.
Instrumental probe of reinforcer devaluation. A: Each curve represents the mean (+/− SEM) number of lever-presses per trial across the first 10 trials. Gray squares represent responses to the cue associated with the non-devalued food, black circles represents responses to the cue associated with the devalued food. B: Each curve represents the mean (+/− SEM) number of cumulative lever-presses per trial across the first 10 trials. White squares and black circles are the same as in A.

