Figure 1.
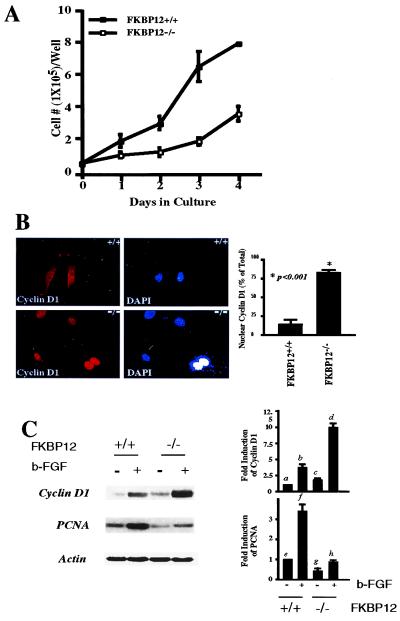
FKBP12−/− fibroblasts are arrested in G1 phase of the cell cycle. (A) Cell growth. For FKBP12+/+ or FKBP12−/− cells, 5 × 10⁴ cells were plated in six-well dishes and counted in 24-h intervals by hematocytometry. Trypan blue dye was used to count viable cells. Data points are the mean ± SEM from three experiments. (B) Cyclin D1 staining. (Left) Nuclear localization of cyclin D1 was observed in more than 80% of FKBP12−/− cells. (Right) The bar graph presents the mean ± SEM from three experiments, with at least 200 cells counted in 10 fields for each experiment (*, P < 0.001). (C) Cell cycle progression in FKBP12−/− cells stimulated with bFGF (25 ng/ml) was monitored by using cyclin D1 (G1 phase) and PCNA (S phase) as markers. In FKBP12+/+ cells, a 24-h bFGF treatment stimulates expression of cyclin D1 4-fold (bar b is different from bar a, P < 0.001) and expression of PCNA 3.5-fold (bar d is different from bar c, P < 0.001), indicating an increase in cells in S phase. In FKBP12−/− cells, cyclin D1 is stimulated 5-fold (bar d different from bar c, P < 0.001) with only a modest increase in PCNA, indicating G1-phase blockade and failure to progress to S phase. Values are the mean ± SEM of five determinations.

