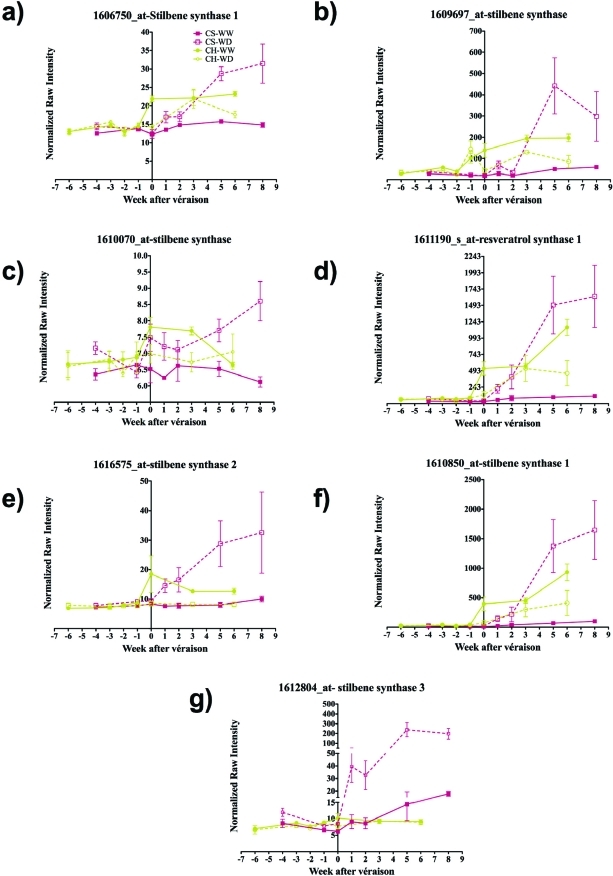
Figure 3.
Gene expression profiles of other stilbene synthases on the microarray. (a) (1606750_at, GSVIVG00009225001, stilbene synthase 1), (b) (1609697_at, GSVIVT00005194001, stilbene synthase), (c) (1610070_at, GSVIVT00009232001, stilbene synthase), (d) (1611190_s_at, GSVIVT00010117001, resveratrol synthase 1), (e) (1616575_at, GSVIVT00009225001, stilbene synthase 2), (f) (1610850_at, GSVIVT00009216001, stilbene synthase 1), (g) (1612804_at, GSVIVT00004047001, stilbene synthase 3). The lines and symbols are the same as in Figure 1. Symbols represent means ± SE; n = 3.

