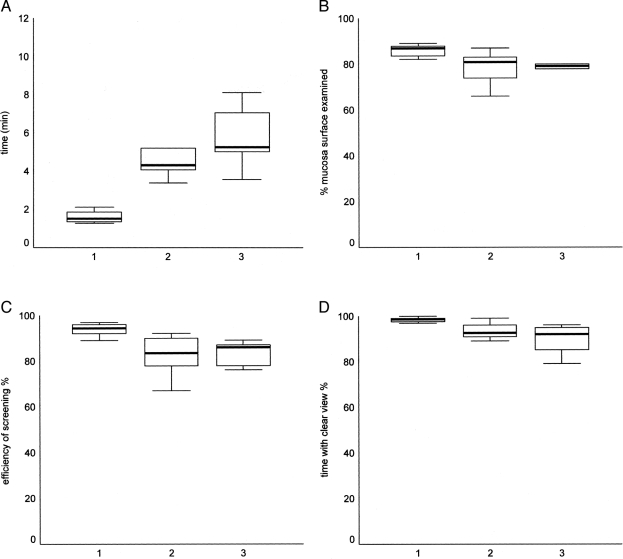
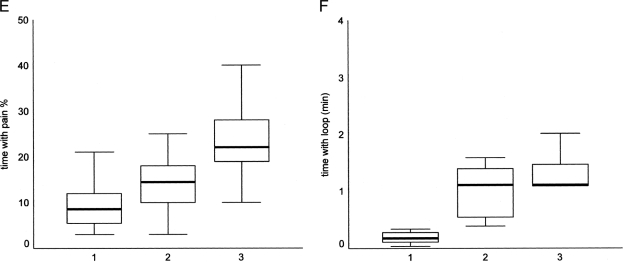
Figure 1.
Comparison of the performance scores between the 3 groups. Group 1 consists of experienced endoscopists (performed >200 endoscopic procedures), group 2 consists of residents (performed <50 endoscopies), and group 3 medical students (never performed endoscopy). Horizontal bands indicate medians, boxes indicate 25th and 75th percentiles, and whisker lines indicate the highest and lowest values for (a) time, (b) percentage of mucosa examined, (c) efficiency of screening, (d) time with a clear view, (e) time with pain, (f) time with a loop.


