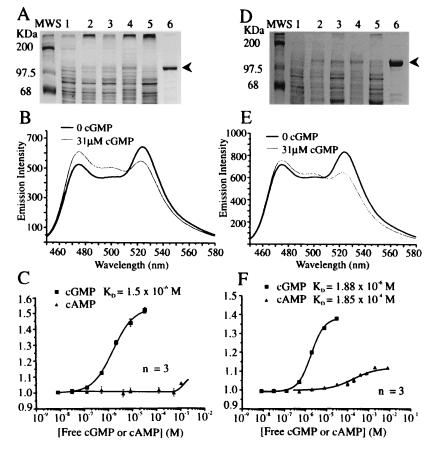
Figure 2.
Purification and in vitro characterization of cygnet-1 (A–C) and cygnet-2 (D–F). (A and D) SDS 12%/PAGE illustrating the 8-AEA-cAMP-agarose affinity–chromatography purification of 123-kDa cygnet-1 and -2 proteins from Sf9 cells. Lanes 1, unexpressed Sf9 cell extracts; Lanes 2, expression induced Sf9 cell extracts; Lanes 3, soluble fractions; Lanes 4, insoluble fractions; Lanes 5, cAMP–agarose washes; Lanes 6, pooled 1-mM cAMP-elutions. (B and E) Fluorescence spectra (excited at 430 nm) with zero and saturating (31 μM) cGMP, respectively. (C and F) Titration curves for cGMP and cAMP, combining three independent measurements. The fitted curves correspond to the apparent dissociation constants and Hill coefficients given in the text.

