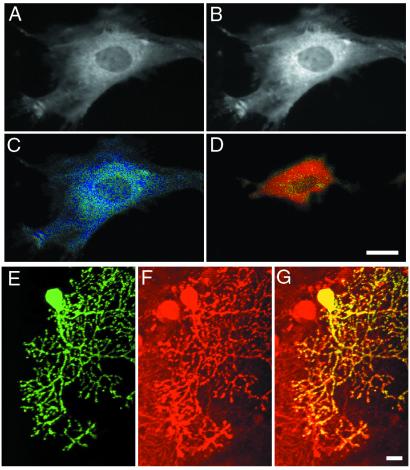
Figure 3.
Imaging of cygnet-2 in RFL and Purkinje cells. (A and B) Cytosolic localization and nuclear exclusion of cygnet-2 in RFL cells as shown by the fluorescence images of ECFP (A; 480 nm emission) and EYFP (B; 535 nm emission). (C and D) Pseudocolor representations of the 480 to 535 nm FRET ratio of a RFL cell at resting (C) and 30 μM cGMP (D). The color change from blue to yellow indicates a 25% ratio change. (E and F) Biolistically transfected cerebral brain preparation showing the EYFP emission of a transfected Purkinje cell (E) and immunostaining for cGPK I by a specific antibody (25) of the identical region (F). (G) Overlay of E and F. (Scale bars = 20 μm in all images.)

