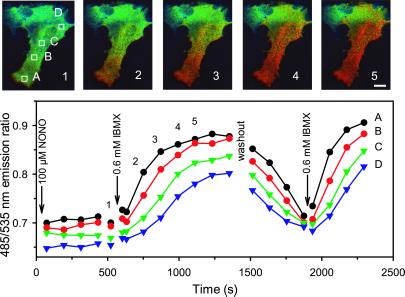
Figure 5.
cGMP wave in RFL cells. (Upper) Fluorescence ratio image of a RFL cell shown at various times (1–5) during a stimulation with 0.1 mM NONO and 0.6 mM IBMX, monitored every 20 s by digital imaging microscopy. The cGMP concentration increase is not uniform, but rather proceeds directionally along the axis of the cell. (Lower) Comparison of response time curves at various locations (A–D) in the cell after stimulation with NONO and IBMX. (Scale bar = 20 μm.)

