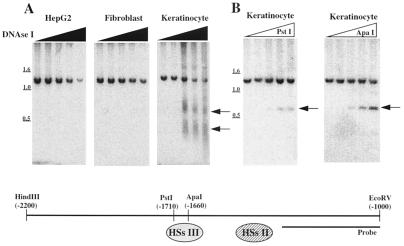
Figure 1.
DNase I HSs and restriction enzyme accessibility in the chromatin of the 5′ flanking region of the K14 gene. Nuclei from fibroblasts, HepG2, and keratinocytes were treated with increasing amounts of DNase I (closed ascending triangle), and isolated DNAs were digested with HindIII and EcoRV and subjected to Southern blotting with a probe as indicated (Lower) in C. The arrowheads in A and B indicate the relative position of the HSs. The molecular weight markers (in kilobases) are indicated on the left.

