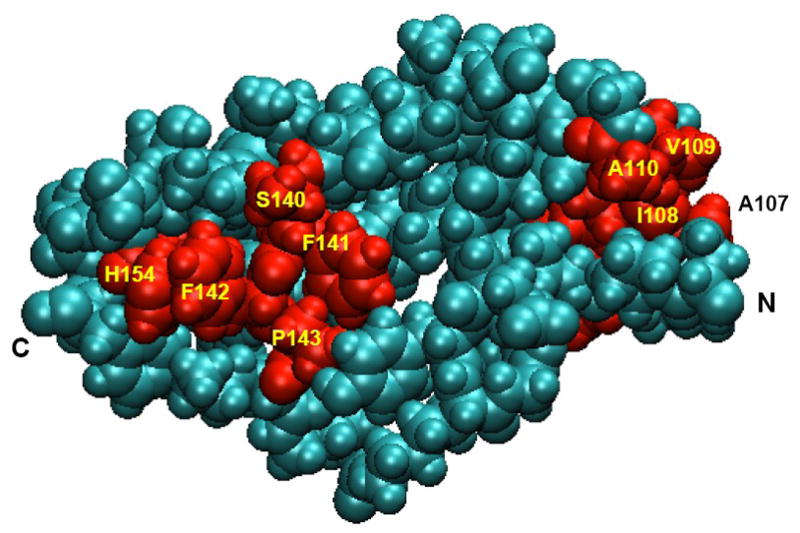
Figure 5.

A space-filling representation of the 2nd LIM domain of wt FHL1, with the residues color-coded to indicate their mean values of EXNS, a measure of excess, solvent-accessible nonpolar surface for the protein atoms in and surrounding the residue (see Supplementary Data, eq. 1). EXNS was calculated with a cutoff radius of 8 Å and was averaged over the 625 structures saved during the MD trajectory. In this image, residues that had mean values of EXNS > 0.1 are colored red and other residues cyan. The viewpoint is rotated 180° about a vertical axis with respect to the viewpoints in Fig. 4. Key residues and the N- and C-termini are labeled. The figure was made with VMD 1.8.7 [24].
