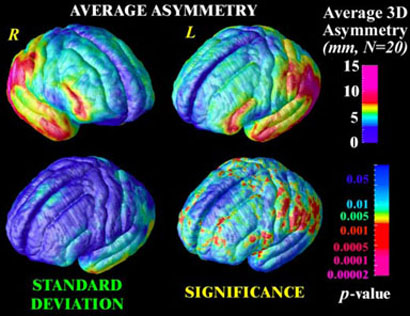
Fig. 3. Mapping Brain Asymmetry in a Population.
The average magnitude of brain asymmetry in a group (N=20, elderly normals) can be assessed based on warping fields that map the cortical pattern of one hemisphere onto the other, and then flow the observations again so that corresponding measures can be averaged across subjects. Variations in asymmetry are also non-stationary across the cortex (lower left), and a Hotelling's T2 statistical field can be computed to map the significance of the asymmetry (lower right) relative to normal anatomic variations.

