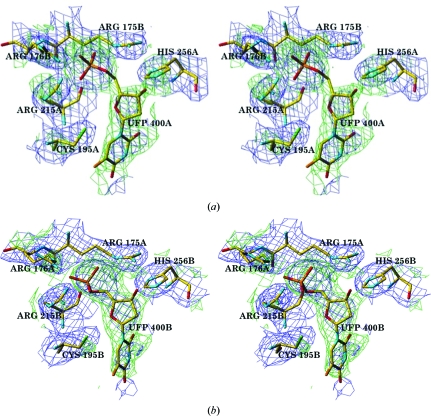
Figure 1.
(a) Stereoview of the hTS active site in subunit A with full occupancy of the ligand FdUMP. (b) Stereoview of the active site in subunit B with partial occupancy of the ligand FdUMP. The F o − F c map (green) is contoured at the 2σ level, with the density of neighboring residues shown in the 2F o − F c map (blue) contoured at the 1σ level.

