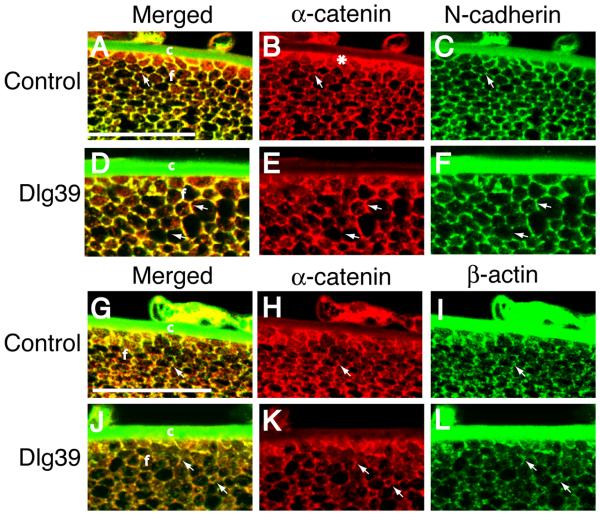
Figure 10. Disrupted fiber cell shape and co-localization of N-cadherin, α-catenin and β-actin in the fiber cells of Dlg39 mice.
Transversely oriented, paraffin embedded eye sections from control (A-C, G-I) and Dlg39 (D-F, J-L) mice were subjected to immunostained with anti-α-catenin (red) and anti-N cadherin (green) antibodies (A-F) or anti-α-catenin (red) and anti-β-actin (green) antibodies (G-L). Shown are representative high resolution images taken from the region just posterior to the transition zone. A-C: Merged and unmerged images of α-catenin (red) and N-cadherin (green) staining in control lenses. (A) Shown is the punctate, overlap in α-catenin and N-cadherin staining (yellow) at the vertices of the hexagonally shaped fiber cells in the lenses of the control mice (arrow). (B, C) Unmerged images showing the staining for α-catenin (red) on all the membranes and staining for N-cadherin (green) primarily at the vertices and short sides of the fiber cells. Also shown is the concentration of α-catenin at the basal tips of the fiber cells (asterisk in B). The green staining of the lens capsule is artifactual, as it was observed in sections stained with secondary antibody only. D-F: Merged and unmerged images of α-catenin and N-cadherin staining in Dlg39 lenses. (D) Shown is the disrupted, nonuniform shape of the fiber cells. Overlap in staining for α-catenin and N-cadherin is sometimes observed along the entire length of the sides of the fiber cells whereas in other cells, overlap is absent (see arrows). (E, F) Unmerged images showing the irregularities in the staining for α-catenin and N-cadherin (arrows). Also notice the accumulation of α-catenin at the basal tips is reduced in the lenses of the Dlg39 mice. G-I: Merged and unmerged images of α-catenin (red) and β-actin (green) staining in control lenses. (G) Shown is the concentrated, punctate, overlap in α-catenin and β-actin staining (yellow) at the vertices of the hexagonally shaped fiber cells (arrow). (H, I) Unmerged images showing the staining for α-catenin (red) on all the membranes and for β-actin (green) concentrated at the vertices of the fiber cells. Also shown is the concentration of α-catenin at the basal tips of the fiber cells (asterisk in H). J-L: Merged and unmerged images of α-catenin and β-actin staining in Dlg39 lenses. (J) Shown is the disrupted, nonuniform shape of the fiber cells. Overlap in staining for α-catenin and β-actin at the vertices is reduced. Some membranes stained for both α-catenin and β-actin in a mainly non-overlapping pattern (arrows). (K, L) Unmerged images showing the irregularities in the staining for α-catenin and staining for β-actin (arrows). c=lens capsule; f=fiber cell compartment. Scale bar=50 μm.

