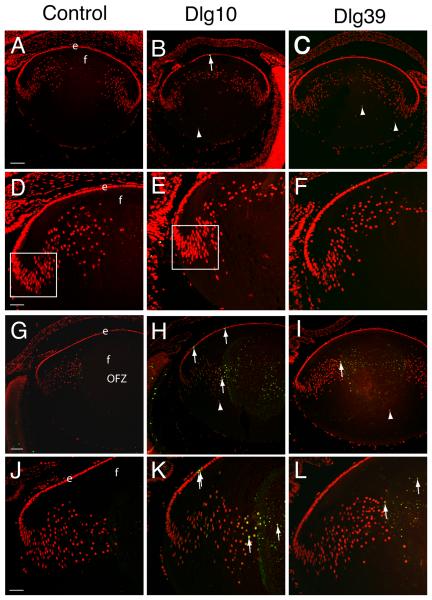
Figure 5. Induction of apoptosis in lenses of postnatal Dlg-1 mutant mice.
Longitudinally oriented, paraffin embedded eyes sections from E17.5 (A-F) and P2 (G-L) control (A,D,G,J), Dlg10 (B,E,H,K) and Dlg39 (C,F,I,L) mice were subjected to fluorescein-TUNEL assay (green) and counterstained with propidium iodide (PI, red). A-C: Low magnification view of lenses from E17.5 control (A), Dlg10 (B) and Dlg39 (C) mice. At E17.5, no apoptotic cells were observed in lenses from control, Dlg10 or Dlg39 mice except for the occasional cell in the epithelium (B, arrow). Shown are defects in nuclear organization in the fiber cell compartment of Dlg10 and Dlg39 mice (arrowheads). D-F: Higher magnification view of lenses in (A-C). Box indicates the high density of nuclei often observed in this region of lenses from the Dlg10 mice. G-I: Low magnification view of lenses from P2 control (G), Dlg10 (H) and Dlg39 (I) mice. Apoptotic cells are readily detected in the center of the lenses from Dlg10 and Dlg39 mice (arrows) and nuclei are also mislocalized (arrowheads). Lenses from Dlg10 mice also showed an increase in the number of apoptotic cells in the epithelium as compared to controls. J-L: Higher magnification views of lenses in (G-I) highlighting apoptotic nuclei in the cortical fibers and center of the lenses (arrows) from Dlg10 and Dlg39 mice and in the epithelium of the Dlg10 mice. e=epithelium, f=fibers. Scale bar=100 μm for A-C, G-I and 50μm for D-F, J-L.

