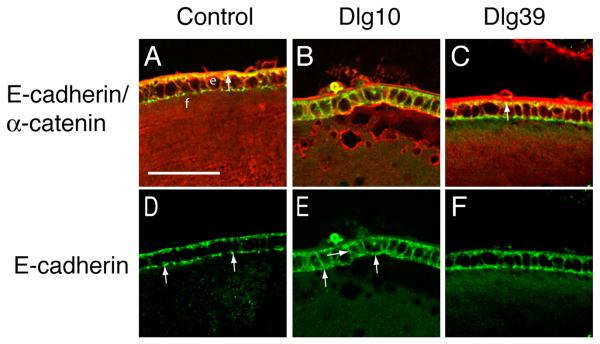
Figure 8. Mislocalization of E-cadherin in the epithelium of Dlg10 mice.
Longitudinally oriented, paraffin embedded eye sections from control (A,D), Dlg10 (B,E) and Dlg39 (C,F) E17.5 embryos were subjected to double immunofluorescence with anti-E-cadherin (green) and anti-α-catenin (red) antibodies. Shown are representative images of a portion of the central epithelium (e) and underlying fiber cells (f). A, D: Merged image (A) of E-cadherin and α-catenin immunostaining on control lenses showing overlap (yellow) in staining along the basal surface of the epithelial cells. The unmerged E-cadherin only image (D) shows the punctate staining for E-cadherin along the apical membrane (arrows) and weak staining along the lateral membranes. B, E: Merged image of E-cadherin and α-catenin staining on lenses of Dlg10 embryos (B) showing a lack of overlap along the basal surface of the epithelial cells and ectopic overlap along basal and lateral membranes. The unmerged E-cadherin only image (E) shows diffuse staining on the apical surface (arrows), and the ectopic staining on the lateral surfaces. (arrows). C, F: Merged image (C) showing overlap in E-cadherin and α-catenin staining in lenses from Dlg39 mice. The pattern of co-localization of E-cadherin and α-catenin is the same as the control, as is the distribution of E-cadherin along the membrane surfaces (F). The intense red staining of the lens capsule in (C) is artifactual, as it was observed in sections stained with secondary antibody only. e=epithelium, f=fibers. Scale bar=50μm.

