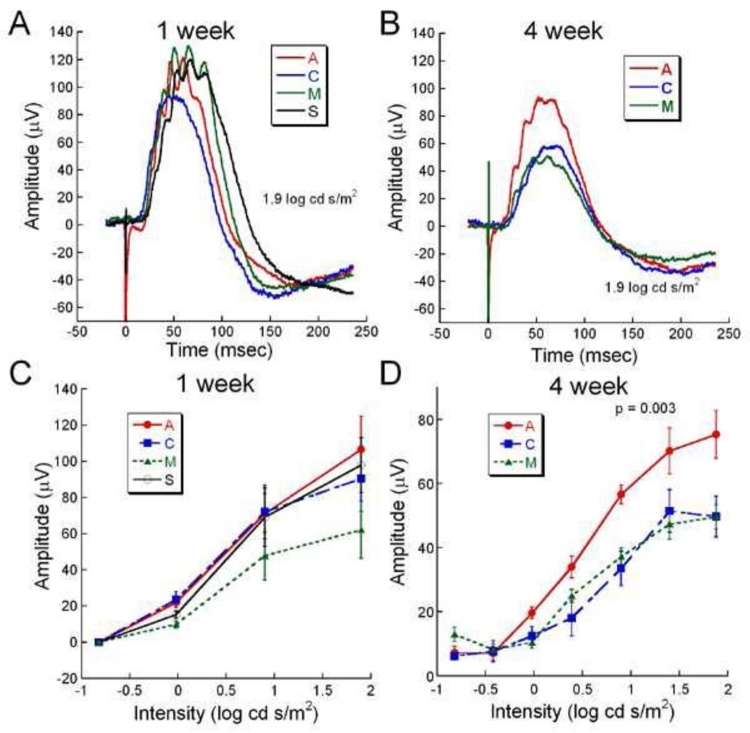
FIGURE 12.
Comparative cone function assessed by light-adapted ERGs at 1 and 4 weeks after surgery. A and B, overlaid representative light-adapted ERGs from each treatment group at 1 and 4 weeks postoperatively. Although no significant differences are observed in the 1-week waveforms, at 4 weeks the A group waveform is ∼45% larger than the C and M waveforms. C, Average light-adapted b-wave amplitude at 1 week postoperatively from the A (n=12), C (n=9), M (n=7), and S (n=7) groups showed no significant differences. D, Average light-adapted b-wave amplitudes from the A (n=5), C (n=3), and M (n=4) groups at 4 weeks postoperatively showed significantly large b-waves in the A group compared to the other groups at moderate to bright intensities. Reprinted with permission from the Association for Research in Vision and Ophthalmology.77

