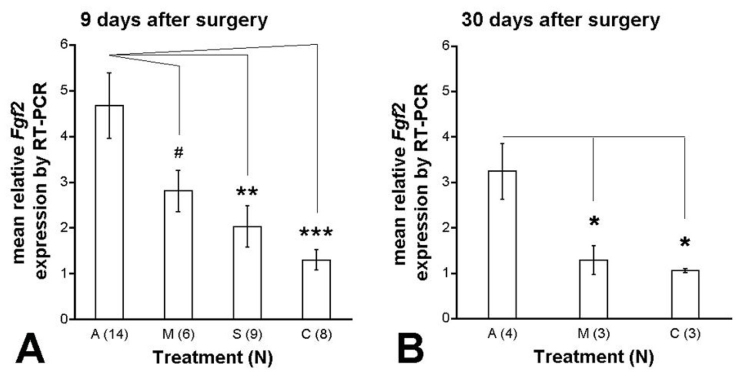
FIGURE 14.
Isolated Fgf2 expression by RT-PCR at 9 and 30 days after surgery. Results are Fgf2 expression in the treated eye relative to the unoperated control eye of the same animal at 9 days and 30 days postoperatively. A, Nine days postoperatively, Fgf2 expression became greater as treatment progressed from C to S to M to A. B, Thirty days after surgery, Fgf2 expression remained significantly greater in the A group compared to the M and C groups. Post hoc Holm-Sidak scores were: #, P = .0501; *, P < .05; **, P < .01, ***, P < .001. Error bars are ± SEM. Reprinted with permission from the Association for Research in Vision and Ophthalmology.77

