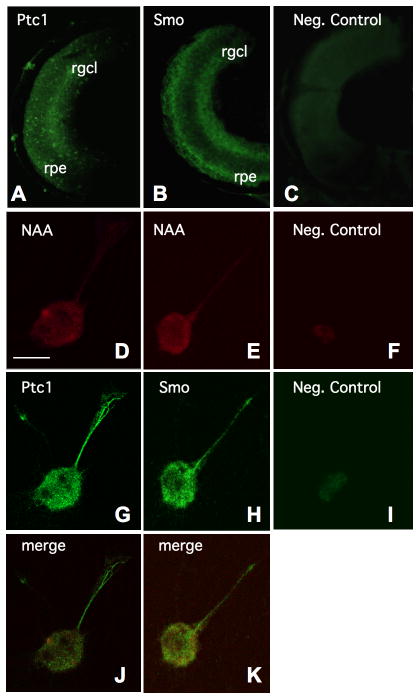
Figure 2. XPtc1 and XSmo co-receptor expression in RGCs.
Ptc1 and Smo expression are observed in the RGC layer and the retinal pigment epithelium (RPE) of sectioned retinas from stage 39 embryos, in A and B, respectively, as compared to a negative control in C. In D and E, individual cultured RGCs are identified by neurofilament associated antigen (NAA) immunoreactivity. These retinal cells are also shown to express both Ptc1 (in G), and Smo (in H). No appreciable staining is detected in negative controls, as shown in F and I. (retinal ganglion cell layer = rgcl, retinal pigment epithelium = rpe, scale bar in D = 10μm)

