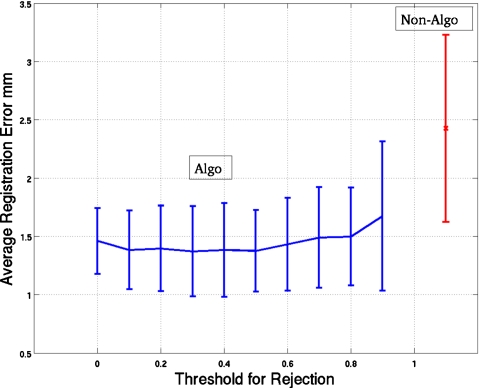
Figure 5.
Mean-registration error over four extreme bins (namely, bins 1, 2, 8, and 9) averaged for the four simulated patients for three NCAT configurations with the 2 cm motion in SI and 6 mm motion in the AP direction. Error is plotted as a function of the threshold (0.0–0.9) used to reject projections used in reconstructing the data sets used to perform the registration. The bars at each point are the standard deviations (of the mean errors over bins) over the four simulated patients and the three configurations. Also plotted are the average error and its SD for the case of not using our algorithm.

