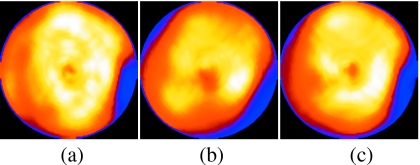
Figure 7.
Polar maps from the NCAT simulation with 2 cm motion including drift. Shown are the maps obtained from the three cases: (a) Reference, (b) no motion correction, and (c) with motion correction. Notice the distortion of the lesion in the lateral wall (right side of the polar map) and artifactual decreased uptake in the inferior wall without motion correction. With motion correction, the inferior wall artifact is reduced and the appearance of the lesion is closer to that of the reference.

