Fig. 3.

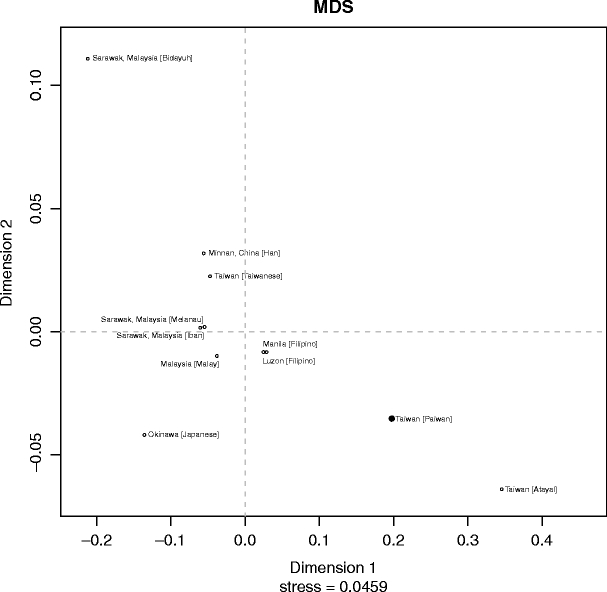
MDS plot based on pairwise Φ st values calculated for the Paiwan (filled circle) and ten reference populations (open circles)

MDS plot based on pairwise Φ st values calculated for the Paiwan (filled circle) and ten reference populations (open circles)