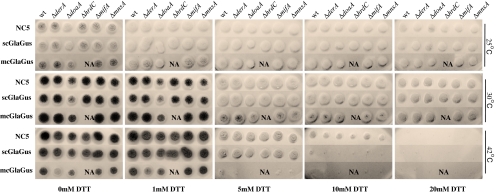
Fig. 7.
Comparison of colony morphology of parental strains and respective ERAD deletion mutants incubated at different temperatures (indicated on the right) and in the presence of increasing concentrations of the stress agent DTT (indicated at the bottom). 104 spores per 10 μl of each strain were spotted on solid MM and growth was monitored for 3 days. NA not available

