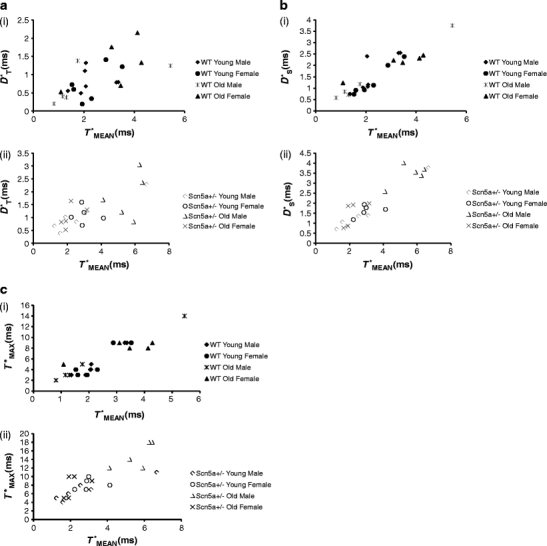
Fig. 4.

Representative plots summarizing linear correlation and regression analysis of D*T, D*S, and T*MAX against T*MEAN. Plots for D*T (a), D*S (b), and T*MAX (c) for WT (i) and Scn5a +/− (ii). The regression analysis demonstrated significant correlations between the parameters of D*T, D*S, and T*MAX on the ordinate and T*MEAN on the abscissa with slopes that were not significantly different whether following stratification by genotype, age, or sex
