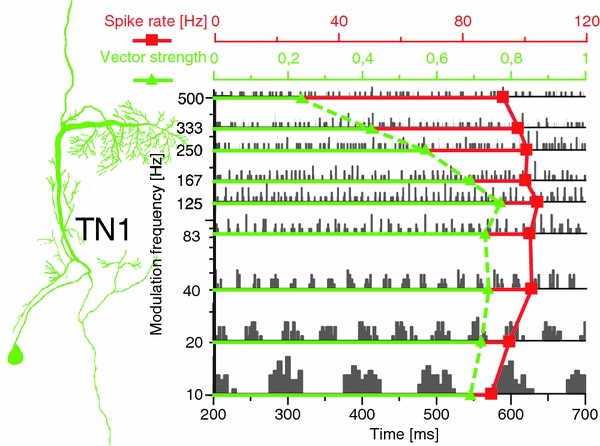
Fig. 1.

rMTF and tMTF curves of a TN1 neuron. Shown are peri-stimulus-time histograms (PSTHs) for modulation frequencies between 10 and 500 Hz. Spike rates (red solid line and squares, upper scale) and vector strengths (green dashed line, triangles, lower scale) are shown for the respective frequencies. On the left, the morphology of the TN1 neuron is depicted
