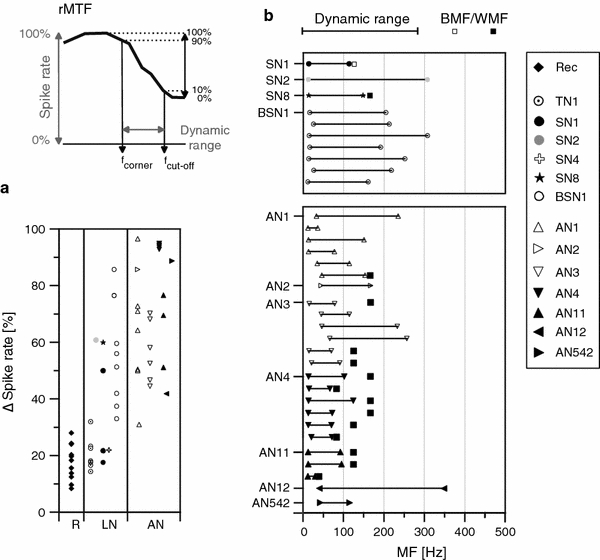
Fig. 3.

Summary diagram of rMTF data. a Difference between maximal and minimal spike rate as an indicator of filter properties (for definitions see inset). R receptors, LN local neurons, and AN ascending neurons. b Dynamic ranges of different neurons. For bandstop filters the position of the lowest response (WMF) is also indicated. Receptor neurons and primary-like neurons with allpass properties are not included in b. Neuron types according to Römer and Marquart (1984) and Stumpner and Ronacher (1991)
