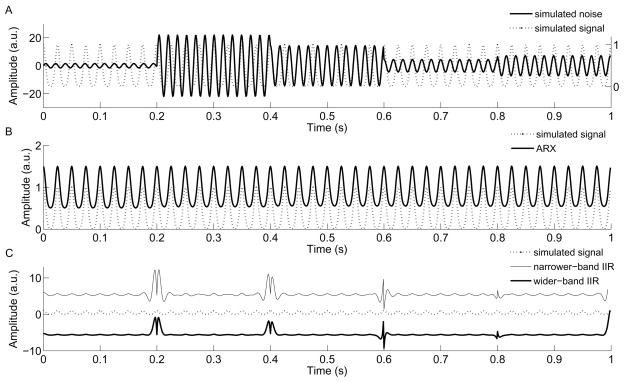
Fig. 2.
Simulation example. (A) Five segments of synthetic data are generated with different SNR levels. In order to mimic the drifting effect of the power line, the frequencies in the first two segments were set at 58 and 62 Hz, respectively. The other three were set at 60 Hz. The dashed curve is the simulated signal component embedded in the sinusoid noises (see right y-axis for its amplitude scale). (B) Comparison of the simulated signal and the estimated signal by ARX model. For visual comparison purpose, the ARX plot was deliberately shifted up by an arbitrary unit 0.5 along y-axis. (C) Comparison of the simulated signal and the results obtained by the IIR filters with 1 Hz (narrower-band) and 2 Hz (wider-band) design. For visual comparison, the narrower-band IIR filtered curve was shifted up by an arbitrary unit 6 along y-axis and the wider-band curve was shifted to the opposite direction. It shows the IIR filter with narrower bandwidth causes more ringing artifact than the wider bandwidth.

