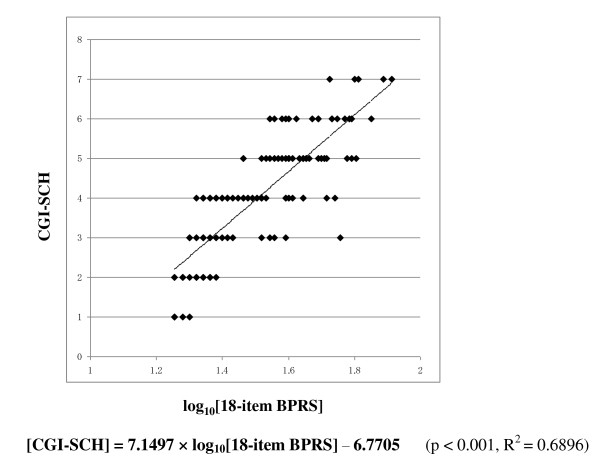
Figure 2.
Scatter plot of the common logarithm of the 18-item BPRS total score and the CGI-SCH score. After performing a common logarithmic transformation on the 18-item BPRS score, the approximately logarithmic curve was modified to an almost linear distribution and the increase in the common logarithm of the 18-item BPRS total score was almost proportional to the increase in the CGI-SCH score.

