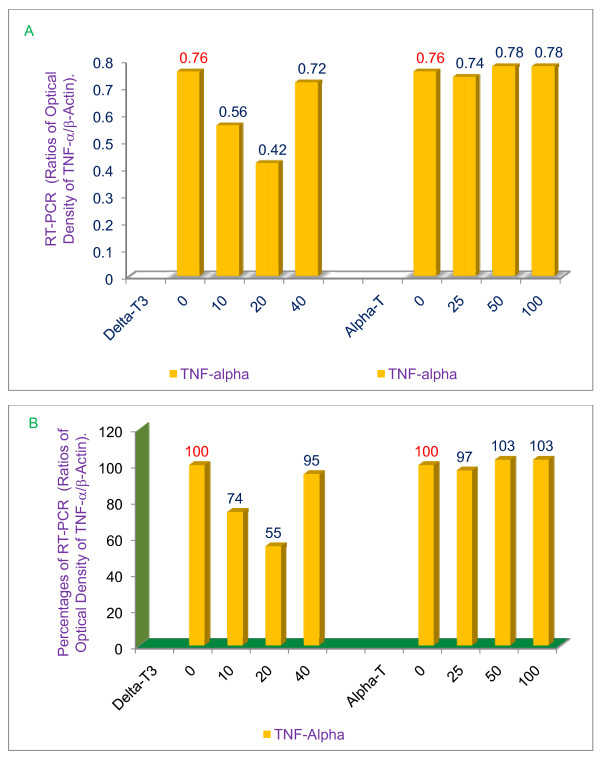
Figure 8.
Effects of α-tocopherol and δ-tocotrienol on the gene expression of TNF-α in LPS-stimulated peritoneal macrophages of 6-week-old BALB/c female mice. The RT-PCR procedure is described in the experimental section. The ratios of relative optical density (TNF-α/β-actin) of each treatment for TNF-α was used to draw this figure, A = values; B = percentages.

