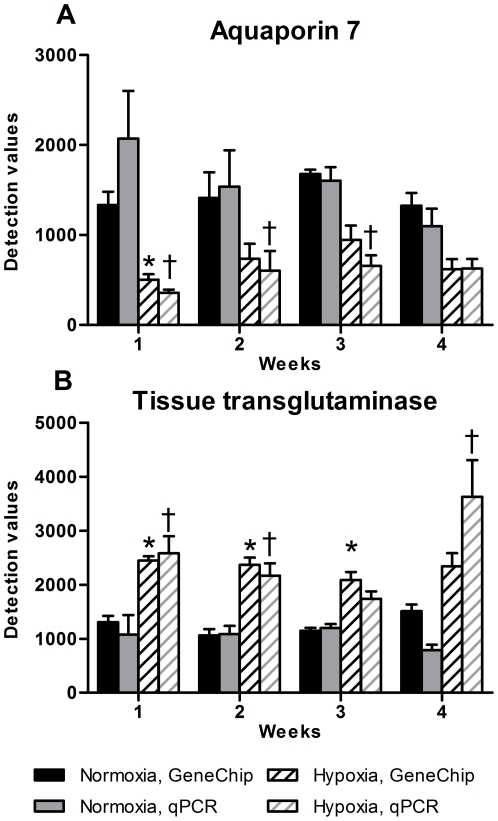
Figure 4. qPCR analysis of aquaporin7 and tissue transglutaminase.
A: gene expression of the aquaporin 7 mRNA by use of gene chip and qPCR shows a decrease in gene expression according to hypoxia. B: gene expression of tissue transglutaminase mRNA by use of gene chip and qPCR shows the opposite impact of hypoxia by increasing gene expression. n = 6 in both groups at all time points.

