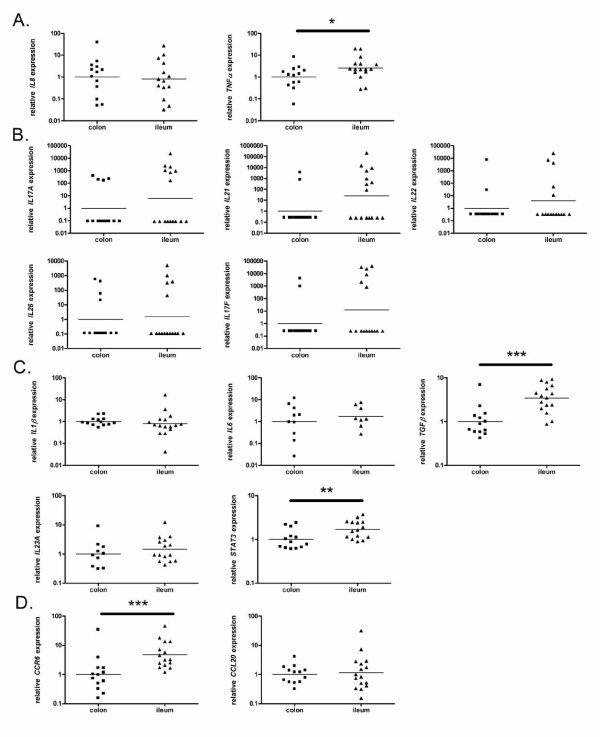
Figure 1.
mRNA expression levels of proinflammatory and Th17-pathway-associated genes in colon and ileum of healthy controls. The relative transcription levels are determined by SYBR Green qPCR using the geometric mean of GAPDH, HPRT and SDHA as an endogenous control in colonic and ileal samples from healthy controls. The data are expressed as geometric means. The geometric mean of the colonic controls was set as 1. Data are presented on a log scale. (a) proinflammatory cytokines, (b) Th17 effector cytokines, (c) Th17 differentiation factors, (d) Th17 recruitment factors. *P < 0.05, **P < 0.01, ***P < 0.001

