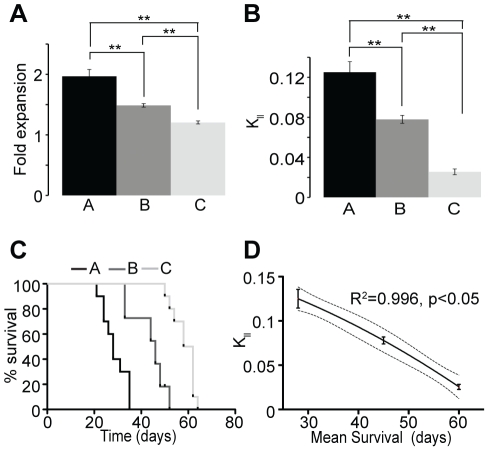
Figure 4. Application of the model to breast cancer.
(a–b) Three breast cancer cell lines were cultured in the mammosphere assay. In these conditions the 3 cell lines displayed different expansion rate and LTP cell symmetric division frequency. **p<1×10⁻⁵, t-test, 2 tails, n = 36–48. (c) Tumor growth was monitored overtime between the 3 groups from which survival analysis was performed and graphed as percentage of animals that have not reach the maximal tumor size (520 mm3) as a function of time. Logrank test, p<0.0001 comparing the three populations to each other, n = 10. (d) Similar to hGBM, tumor progression after breast cancer cell s.c. transplantation was directly and inversely correlated to the symmetric division rate of the LTP cancer cell. The dashed lines correspond to the 95% confidence band of the fit curve obtained by nonlinear regression (y = 0.1743 – 0.001123x – 0.00002258x2). Coefficient R2 and p value are also shown.

