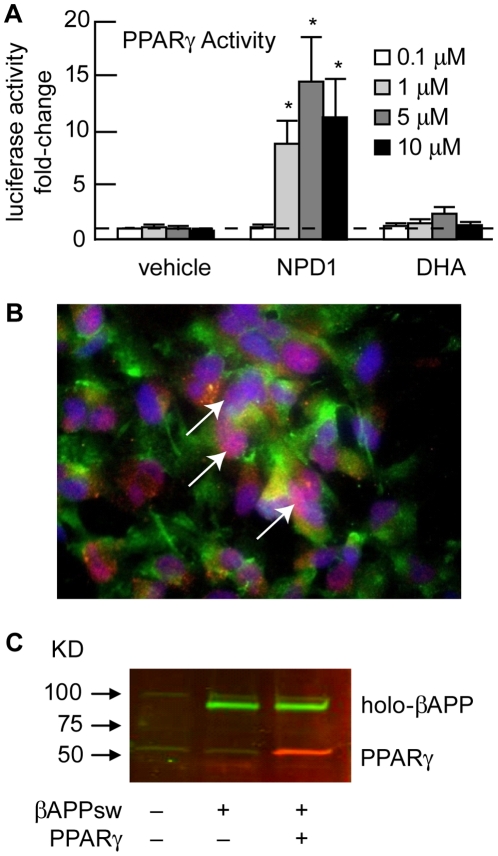
Figure 9. NPD1 activates PPARγ.
(A) PPARγ activities upon incubation with NPD1 or DHA are shown in bar graph format. The activation of PPARγ by NPD1 and DHA was assessed using a cell-based luciferase reporter transactivation assay after incubation with increasing concentrations (0.1, 1.0, 5.0 and 10.0 µM) of NPD1 or DHA for 24 h. Luciferase activity was normalized to β-gal activity (transfection efficiency control) and results were expressed as fold-change of induction relative to vehicle treated HNG cells (n = 4). Horizontal dashed line at 1.0 indicates control PPARγ levels at 1 µM for ease of comparison; *p<0.01 vs. corresponding vehicle controls. (B) Co-transfection of βAPPsw and PPARγ in HNG cells; immunofluorescence detection of βAPPsw (green; λ = 530 nm) and PPARγ (red; λ = 670 nm) in HNG cells over-expressing both proteins; HNG nuclei are stained with DAPI (blue; λ = 470 nm); overlap of PPARγ and HNG cell nuclear signal (violet; λ = 420 nm; arrows) indicates nuclear association of PPARγ; 40x magnification. (C) Two-color Western blot with Odyssey infrared imaging showing over-expression of both βAPPsw (green) and PPARγ (red) in whole HNG cell extracts.

