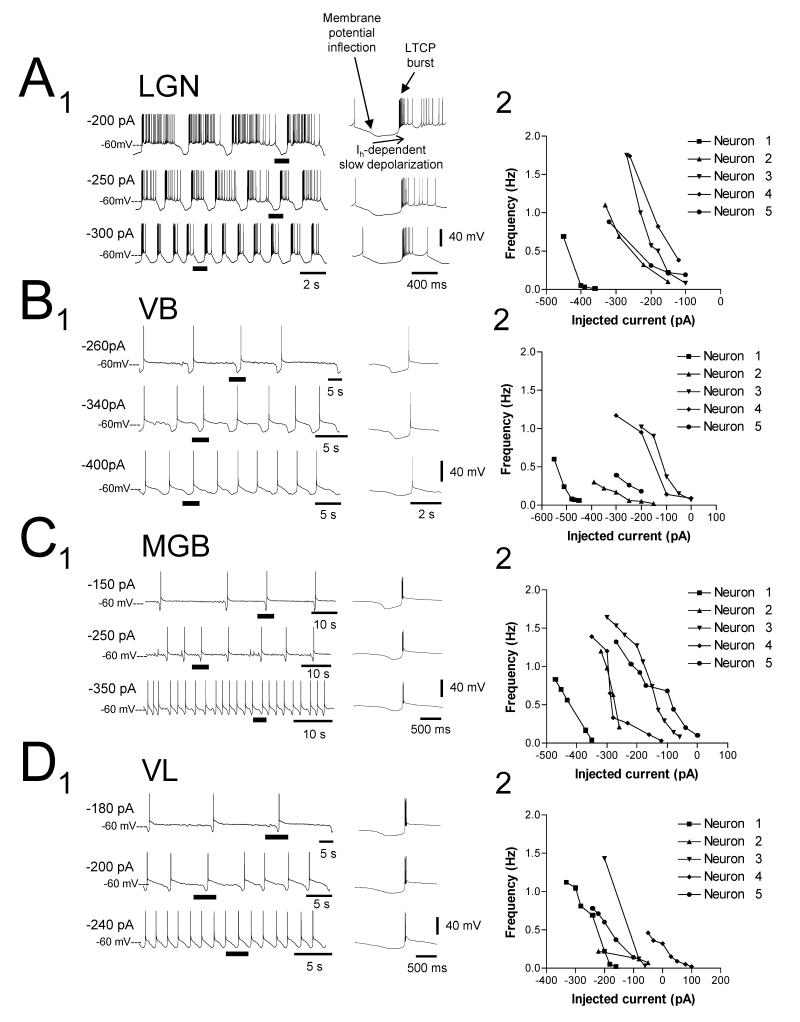
Figure 3. Comparison of the relationship between injected d.c. current and slow oscillation frequency in TC neurons of the cat LGN, VB, MGB and VL.
A1, B1, C1, and D1. Examples of the slow oscillation in TC neurons of the cat LGN, VB, MGB and VL, respectively, at different levels of injected d.c. current as indicated. All underlined sections are expanded on the right and indicate an invariance of the DOWN state with respect to membrane polarization (see also Fig. 6A3 and 6B3). Note that in all cases, i) the UP state of the slow oscillation commences with an LTCP burst, ii) the UP to DOWN state transition is marked by a clear membrane potential inflection, and iii) the DOWN state is shaped by a slow, Ih-dependent depolarization (Hughes et al., 2002b). A2-D2. Plots showing the relationship between slow oscillation frequency and injected d.c. current for 5 different neurons in each nucleus. The traces in A1-D1 correspond to neurons 5, 2, 4 and 5 in the respective plots. Note how the vast majority of neurons only exhibit a slow oscillation for negative steady d.c. current values.

