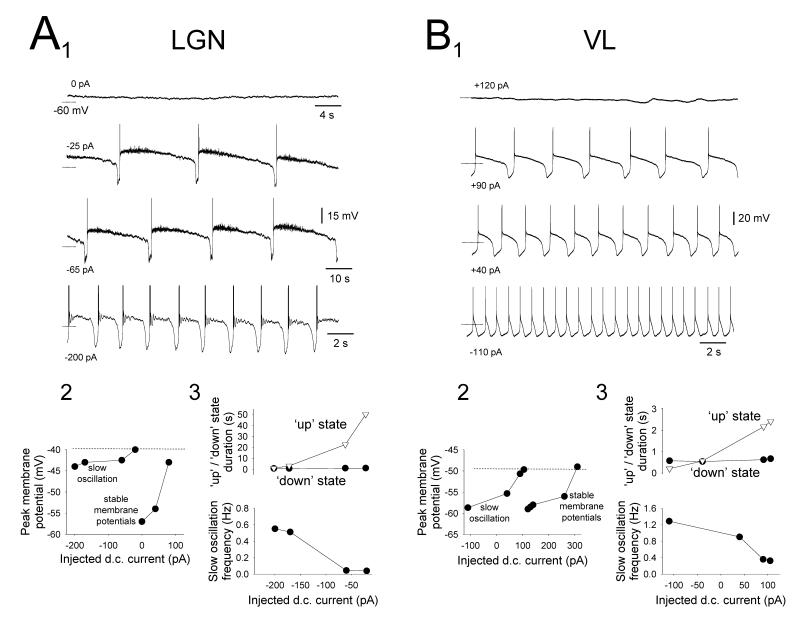
Figure 6. Specific properties of the ‘quiescent’ slow oscillation in cat TC neurons.
A1. Changes in the activity of a cat LGN TC neuron exhibiting a ‘quiescent’ slow oscillation without δ ‘grouping’ in response to variations in injected d.c. current. Note the characteristic increase in frequency that occurs with hyperpolarization. A2. Plot showing the peak membrane potentials evident at different levels of injected current. Note that the maximum level of depolarization generated by the UP state (dotted lines) is greater than a range of stable membrane potentials displayed by this neuron when it is subjected to more steady depolarizing current and, specifically, is larger than the resting membrane potential of this neuron (i.e. at 0 pA). A3. Plots showing the variation in UP ( ) and DOWN (•) state duration (top) and slow oscillation frequency (bottom) with respect to injected d.c. current, confirming that changes in frequency occur almost exclusively through a variation in the UP state duration. B1. Changes in the activity of a cat VL TC neuron exhibiting a ‘quiescent’ slow oscillation without δ ‘grouping’ in response to variations in injected d.c. current. B2. Plot showing the peak membrane potentials evident at different levels of injected current. As in the neuron shown in A, the UP state generates levels of depolarization which can be greater than some of the stable membrane potential levels reached by this neuron when it is subjected to more steady depolarizing injected current than during the slow oscillation. B3. Plots showing the variation in UP (
 ) and DOWN (•) state duration (top) and slow oscillation frequency (bottom) with respect to injected d.c. current. Again, this confirms that changes in frequency occur almost entirely through a variation in the UP state duration. Note the more depolarized membrane potentials reached during the UP state of the LGN slow oscillation shown in A2 compared with those from the VL in B2 (see Table 1).

