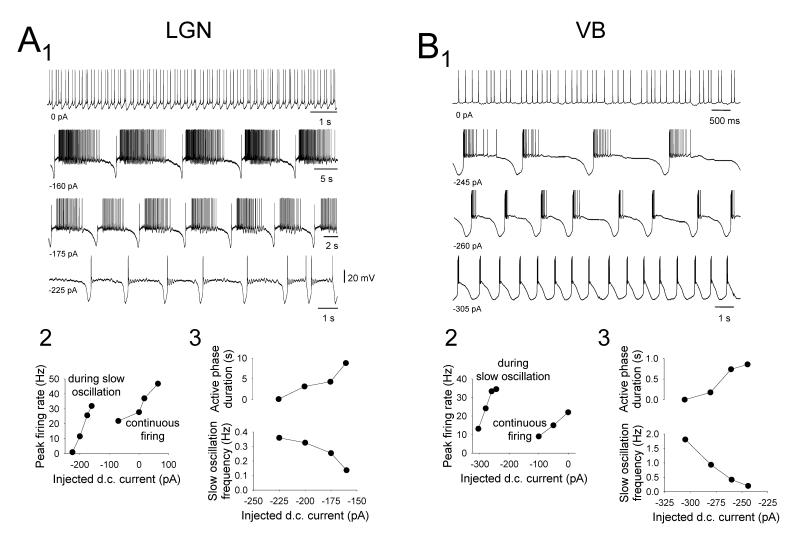
Figure 7. Specific properties of the ‘active’ slow oscillation in cat TC neurons.
A1. Changes in the activity of a cat LGN TC neuron exhibiting an ‘active’ slow oscillation in response to variations in injected d.c. current. Note also the almost complete lack of UP state firing when the slow oscillation is at its fastest in the bottom trace A2. Plot showing the peak firing rate evident at different levels of injected current. For the slow oscillation this indicates the degree of excitation generated by the UP state (see methods). Note that the UP state can support more intense firing than is present when the neuron fires continuously in response to greater amounts of steady injected current. A3. Plots showing the variation in the duration of the ‘active’ phase (top) and slow oscillation frequency (bottom) with respect to injected current. B1. Changes in the activity of a cat VB TC neuron exhibiting an ‘active’ slow oscillation in response to variations in injected d.c. current. B2. Plot showing the peak firing rate evident at different levels of injected current. Again, note that the UP state can support more intense firing than is present when the neuron fires continuously in response to greater amounts of steady current. B3. Plots showing the variation in the duration of the ‘active’ phase (top) and slow oscillation frequency (bottom) with respect to injected current. Note that the extent to which additional firing occupies the UP state in the VB oscillation shown in B2 is noticeably less than for the LGN case shown in A2 (see also Figs. 4C and 4D).

